News
Cape Town dam levels drop to 60% after another dry week
Cape Town dam levels slide again as summer dryness bites
Cape Town residents have grown used to keeping an eye on dam figures, and the latest update offers little comfort. As of 2 February 2026, the city’s combined dam levels have dipped to 60.1%, marking another steady slide in what has been a stubbornly dry start to the year.
Just a week earlier, the system was sitting at 62.2%. In real terms, that small percentage drop translates into a significant loss of water. Nearly 19,000 megalitres disappeared from storage in only seven days. The total volume fell from 559,008 megalitres to 540,243 megalitres, a reminder of how quickly reserves can shrink when rain stays away.
A worrying comparison with last year
What makes the current situation more unsettling is how it stacks up against 2025. At the same time last year, the Western Cape’s dams were sitting comfortably above 80%. Today’s levels are roughly twenty percentage points lower, placing the region in a far more vulnerable position as summer continues.
The Western Cape Water Supply System does not serve Cape Town alone. It also supports towns across the Overberg, Boland, West Coast, and Swartland, while supplying irrigation water that underpins large parts of the province’s agricultural economy. Any sustained decline has ripple effects well beyond city limits.
How the water is shared
Under current licensing arrangements, the City of Cape Town is permitted to abstract about 60% of the available water. Agriculture accounts for roughly a third, with the remaining portion allocated to smaller towns. This balance has long been a sensitive issue, particularly during dry cycles, and it is already resurfacing in public conversations online, where residents are questioning how best to stretch the remaining supply without crippling food production.
Big dams, uneven drops
The six major dams feeding the system have not all behaved the same way over the past week. Steenbras Upper recorded the sharpest decline, sliding from 78.9% to 69.2% in just seven days. Berg River Dam also fell noticeably, moving from 63.8% to 60.7%.
Theewaterskloof, the province’s largest reservoir and often seen as the bellwether for Cape Town’s water security, dropped from 57.2% to 55.6%. Voëlvlei and Wemmershoek showed smaller but still concerning decreases, while Steenbras Lower slipped from 58.7% to 55.6%.
When compared year on year, every major dam is significantly lower than it was in early 2025. Steenbras Upper, for example, stood at over 96% last year. Berg River was above 80%, and Theewaterskloof was also comfortably past that mark.
No rain, nowhere
Perhaps the most telling detail in the latest update is the rainfall data. For the week ending 1 February, not a single monitored catchment recorded any precipitation. Areas including Table Mountain, Theewaterskloof, Voëlvlei, Wemmershoek, and Newlands all logged zero rainfall, extending a dry spell that began in late January.
With cumulative February rainfall still sitting at zero, the lack of inflow is directly feeding the ongoing decline in storage. Long-term averages suggest February can bring moderate rain, so there is cautious hope that conditions may still shift. For now, though, the dams are relying entirely on what remains in storage.
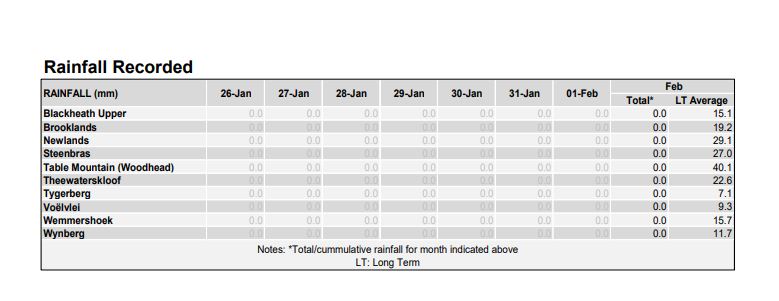
Image 1: CT/DWS Weekly report
Smaller dams, similar story
It is not only the big reservoirs feeling the pressure. The region’s minor dams, eight in total, are collectively sitting at 48.8% capacity. That represents another weekly drop, and individual dams vary widely. Some, like Land en Zeezicht in Helderberg, remain relatively healthy, while others, including Hely Hutchinson on Table Mountain, are alarmingly low.
A familiar but uneasy moment
For many Capetonians, these numbers stir memories of the Day Zero years, when dam updates became daily reading and water saving turned into a way of life. While officials have not signalled immediate restrictions, the steady downward trend has already sparked concern on social media, with calls for early action rather than last-minute panic.
The city has repeatedly stressed that overall storage percentage is the best indicator of water security, given the different sizes of each dam. By that measure, the system is clearly under strain. Whether late summer rains arrive in time to slow the slide remains the key question hanging over the months ahead.
Follow Joburg ETC on Facebook, Twitter, TikT
For more News in Johannesburg, visit joburgetc.com
Source: The Citizen
Featured Image: NovaNews