News
What R868 a month can and cannot buy in South Africa
Stats SA’s food poverty line is R868 a month (R28.55/day). Here’s what that figure measures, how it’s calculated and why it falls short of a liveable household budget.
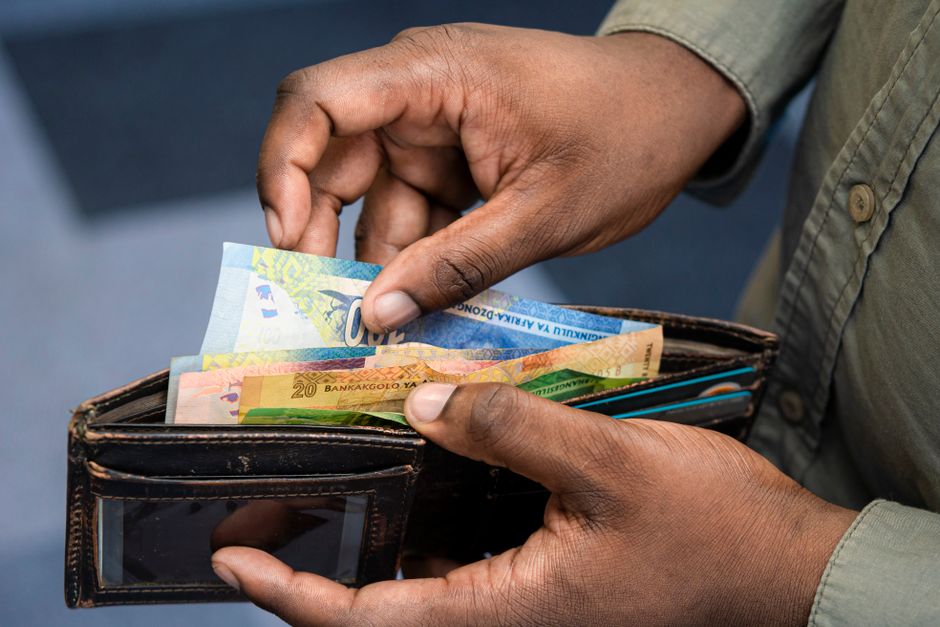
Statistics South Africa’s food poverty line for 2026 is R868 per person per month about R28.55 a day the amount the agency calculates is needed to secure the minimum daily energy requirement of 2,100 calories. That number, however, measures a narrow minimum for calories, not a liveable or nutritionally complete household budget.
How the food poverty line is calculated
Stats SA constructs a reference food basket from the consumption patterns of poorer households, deliberately excluding the poorest 10% and instead using households in expenditure deciles two to six. The resulting basket contains 46 foods commonly consumed by those households, including maize meal, bread, rice, chicken, chicken heads and feet, offal, polony, canned fish, beans, potatoes, cabbage, cooking oil, sugar and tea.
Crucially, the agency found that observed food expenditure among the reference households supplied only 1,211 calories per person per day, well below the 2,100-calorie benchmark. Stats SA therefore scales that expenditure up to estimate the cost of reaching 2,100 calories, which produced a food poverty line of R777 in 2023 prices, later adjusted to R868 for 2026.
Calories versus nutrition
Securing sufficient calories is not the same as securing adequate nutrition. The Pietermaritzburg Economic Justice and Dignity Group (PMBEJD) estimated in August that the average cost of a basic nutritious diet for a child was R961.96 a month already nearly R100 more than the R868 food poverty line.
PMBEJD’s household food basket, which is based on foods women living on low incomes say they try to buy each month, cost R5,479.80 for a seven-person household in August and was explicitly described as not nutritionally complete. A nutritionally complete basket for the same household would cost R6,597.25.
Why poverty lines differ from liveable budgets
Poverty lines are statistical tools for measuring and tracking deprivation. Stats SA also publishes a lower-bound line of R1,457 per person per month and an upper-bound line of R2,962 per person per month. The lower-bound line reflects households forced to sacrifice some food needs to pay for essential non-food items; the upper-bound line is intended to reflect meeting minimum food and non-food needs without sacrificing food requirements.
Stats SA cautions that national poverty lines were not designed to determine minimum wages, social grants or other policy thresholds. They measure thresholds for statistical consistency, not the full set of costs a household faces.
Illustrative household costs show the gap
According to IOL, a small flat in Yeoville can currently be advertised for about R1,114 a month. IOL also reports that a real prepaid electricity purchase of R1,000 buys about 283kWh at around R3.53/kWh. PMBEJD estimated in January that two daily taxi journeys in Pietermaritzburg cost about R1,680 a month, with transport in Johannesburg typically higher.
According to IOL, putting those three items together rent at R1,114, electricity at R1,000 and transport at R1,680 produces a subtotal of R3,794 a month. IOL calculates that adding Statistics South Africa’s R868 food poverty allowance brings this stripped-down illustrative monthly cost to R4,662, which IOL notes is R1,700 more than Statistics South Africa’s R2,962 upper-bound poverty line. IOL stresses that these are examples, not representative budgets but they illustrate the problem with translating a per-person poverty threshold into daily life.
Broader measures of need
Other tools attempt to capture a fuller household reality. The OpenUp Living Wage calculator, for example, includes 11 categories of household expenditure food, transport, housing, utilities, healthcare, hygiene, education and communications among them to estimate what a household actually needs to get by rather than merely survive.
PMBEJD’s modelling of a minimum-wage worker supporting four people found that after paying only transport and electricity, the worker would have R1,653.35 left for everything else, illustrating the tight trade-offs low-income households face between essential needs.
Scale of food poverty
Stats SA’s latest poverty measurement found that about 10.8 million South Africans were living below the food poverty line in 2023. The World Bank describes South Africa’s income distribution as having a relatively small middle class and a large low-earnings group, with the bottom 40% of the population receiving just 11.5% of total income.
What the R868 figure means and what it does not
R868 marks the point below which Stats SA says a person cannot afford the minimum food energy they need. It does not, on its own, represent a liveable household budget or the cost of a nutritious diet. As the figures above show, once rent, electricity and transport are added, even the most stripped-down illustrative monthly budget can exceed higher official poverty lines.
According to IOL, these examples highlight why a statistical poverty threshold should not be mistaken for a workable household budget.
Follow Joburg ETC on Facebook, Twitter, TikTok and Instagram
For more News in Johannesburg, visit joburgetc.com
Source: iol.co.za