News
Where the rand sits among Africa’s 10 strongest currencies
A look at Africa’s top 10 currencies by nominal value versus the US dollar and where the South African rand ranks, with latest rand exchange-rate context.
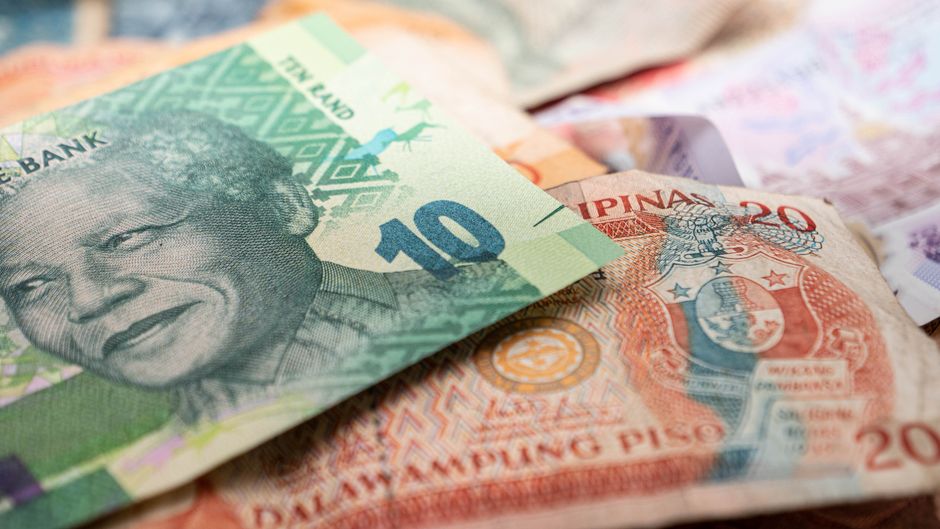
The South African rand ranks eighth among Africa’s top 10 currencies by nominal value against the US dollar,
How the ranking works
“The ranking is based on how many units of each local currency are needed to buy US$1. The fewer units required, the higher the currency’s nominal value against the dollar.”
Where the rand sits
According to The South African, the rand sat around eighth in the latest ranking, with approximately R16.16 to R16.19 required to buy US$1 on 2 September 2026. The publication noted that the rand is one of Africa’s most actively traded currencies and that its value is sensitive to global investor sentiment and commodity-price shifts.
The top 10, by nominal value
According to The South African, the continent’s top 10 currencies by nominal exchange rate versus the US dollar were:
- Tunisia Tunisian dinar (TND): about 2.9 TND per US$1.
- Libya Libyan dinar (LYD): about 6.4 LYD per US$1.
- Morocco Moroccan dirham (MAD): about 9.3 MAD per US$1.
- Ghana Ghanaian cedi (GHS): about 11.3 GHS per US$1.
- Botswana Botswana pula (BWP): about 13.4–13.5 BWP per US$1.
- Seychelles Seychellois rupee (SCR): about 13.9 SCR per US$1.
- Eritrea Eritrean nakfa (ERN): about 15 ERN per US$1.
- South Africa South African rand (ZAR): about 16.2 ZAR per US$1.
- Eswatini lilangeni (SZL): about 16.1–16.2 SZL per US$1.
- Namibia Namibian dollar (NAD): about 16.1–16.2 NAD per US$1.
Notes on peg arrangements and currency drivers
According to The South African, the Eswatini lilangeni trades at almost the same level as the rand because it is pegged at par to the South African rand. The publication also reported that the Namibian dollar is pegged one-to-one to the rand, which helps explain the close alignment of those currencies’ exchange rates against the US dollar.
Exchange-rate context for the rand
Independent rate data show recent movement in the rand ahead of the September ranking. Trading Economics reported that, as of 31 August 2026, the rand traded at approximately ZAR 16.11 to US$1, with a one-month change of +2.49% and a year-to-date change of +8.51%. These figures provide context for the R16.16–R16.19 range published on 2 September.
What the ranking does and does not show
The list is based on nominal exchange rates the simple arithmetic of how many local currency units buy one US dollar and does not account for purchasing power, economic size, inflation or other measures of economic strength. The South African noted that the rand’s ranking should be interpreted carefully because exchange rates can be volatile and influenced by factors such as commodity prices, monetary policy and foreign-exchange controls.
For readers tracking currency moves, the ranking offers a snapshot comparison of nominal currency values across Africa rather than a comprehensive assessment of economic performance.
Follow Joburg ETC on Facebook, Twitter, TikTok and Instagram
For more News in Johannesburg, visit joburgetc.com
Source: thesouthafrican.com